 SHL Numerical Reasoning Test Questions [2025]
SHL is one of the most common aptitude test providers, and the SHL Numerical Reasoning Test is considered the most difficult of all SHL Tests. It is part of the hiring process for many organizations.
The test measures your numerical reasoning skills, such as numerical data interpretation, performing basic calculations, and mathematical problem-solving.
Practice tests can be a significant aid in preparing for the SHL Numerical Assessment. Below is a 5 question practice test for the SHL Numerical Reasoning Test.
Free SHL Numerical Reasoning Practice Test
What is the SHL Numerical Reasoning Test?
The SHL Numerical Reasoning Test is a measurement of your ability to extrapolate and interpret numerical data provided by SHL Solutions. It is one of the most common aptitude tests faced by many candidates for various positions.
The SHL Numerical Assessment is known for its strict time limits. It consists of 10 questions to be answered in 18 minutes.
The test is typically provided in one of two formats:
- Interactive Format - This version of the numerical reasoning test consists of graphs and tables that can be adjusted using a standard keyboard and mouse. Sample questions can be found below.
- Multiple-choice - The multiple-choice format covers the same subjects: graphs and tables and numerical data interpretation. However, the graphs and diagrams are not interactive. Instead, the candidate must choose the correct answer out of five options.
The two versions of the test are similar in difficulty level. The Interactive numerical reasoning test has largely supplanted the non-interactive format.
Let's jump directly into practice questions:
SHL Numerical Test - Non-Interactive Questions
This test version requires you to solve questions independently and choose the right solution from five options. You can prepare for this assessment by answering the following sample questions:
1. Sample Graphs Question
Observe the following graph and answer the question below:
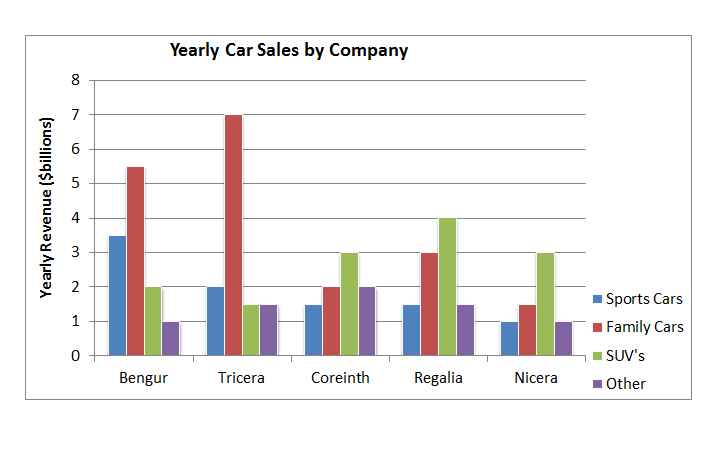
If it costs Bengur £13,500 to make a sports car and it is sold for £25,000, what is the profit for the Bengur sports car division?
Please mark the most relevant answer.
A. £1.4 billion
B. £1.51 billion
C. £1.89 billion
D. £2.89 billion
E. Cannot Say
Answer:
First, find the number of sports cars sold by Bengur. According to the chart, Bengur made £3.5 billion in revenue from sports car sales. The question states that the market price of each car is £25,000; thus, the number of sports cars sold by Bengur is 3,500,000,000 / 25,000 = 140,000.
Next, find the profit from selling a single sports car. If each car costs £13,500 to make and generates a revenue of £25,000, then the profit for each car is:
Profit = Revenue – Cost = £25,000 - £13,500 = £11,500.
Finally, find the total profit of the sports car division by multiplying the profit per car by the total number of sports cars sold:
11,500 x 140,000 = £1.61 billion
Thus, the correct answer is £1.61 billion
2. Sample Table Question
Observe the following table and answer the question below:
| Products | No. of Employees (thousands) | Value of Extracted Produce (millions) | Market Value (millions) | |
|---|---|---|---|---|
| Asia | U.S.A | |||
| Oil | 2,572 | $7,568 | $487 | $1,574 |
| Copper | 1,235 | $3,587 | $831 | $928 |
| Coal | 957 | $3,456 | $728 | $1,375 |
| Uranium | 1,542 | $6,875 | $427 | $3,208 |
| Silver | 1,012 | $3,500 | $700 | $1,789 |
By how much does the value of extracted Silver per employee exceed that of Copper?
Please mark the most relevant answer.
A. $5,859
B. $54
C. $35,789
D. $554
E. Cannot Say
Answer:
The value of extracted Silver per employee = 3,500,000,000 / 1,012,000 = $3458
The value of extracted Copper per employee = 3,587,000,000 / 1,235,000 = $2904
To find by how much the overall value of extracted Silver per employee exceeds that of Copper, subtract the latter from the first: 3458-2904 = $554.
The value of extracted Silver is $554 higher than the value of extracted Copper per employee.
The correct answer is (D) - $554
TIP: This SHL Assessment, like all other SHL tests, uses percentile rank for its scoring system. This means your grade will depend on your performance relative to other test-takers and not on your absolute score.
3. Sample Ratios Question
In Andy’s closet, for every one white shirt there are two black trousers, three red shirts, and five grey socks. What is the ratio of shirts to other clothing items?
Please mark the most relevant answer.
A. 1:10
B. 4:11
C. 4:7
D. 7:4
E. 11:4
Answer:
The simplest solution to a problem like this is to assume the smallest numbers possible. In this case, if there is one white shirt, there are two black trousers, three red shirts, and five grey socks. That means there are four shirts in total (one white and three red) and seven non-shirts (two black trousers and five grey socks). Therefore, the ratio of shirts to other clothing is 4:7.
The correct answer is (C) – 4:7
As you might already be able to tell, SHL numerical reasoning tests require you to interpret numerical data swiftly and accurately. This is an acquired skill: the charts and graphs may look intimidating at first, but after a good number of practice tests, you should be able to find the information you need without hesitation.
If you are looking for more practice tests to prepare for the SHL Numerical Reasoning Test, our SHL practice course features more than 1,000 practice questions covering all aspects of both the interactive version and the non-interactive version. The questions simulate the real test and include full explanations that delve deeply into the mathematical theory. The course also features full-length practice tests.
The SHL Numerical Reasoning Test is SHL's comprehensive numerical exam, intended to evaluate various aspects of your numerical abilities, including ratios, percentages, data interpretation, and more. SHL also offers a shorter exam, the SHL Calculation Test, which measures only your ability to perform mental arithmetic. This test is similar to the Optiver Test.
Other common numerical exams include the Aon Numerical Test, the Talent-Q Aspects Numerical, the Cappfinity Numerical Reasoning Test, and the Saville Numerical Analysis Test.
- Take a full numerical reasoning practice test.
- Take a full cognitive ability practice test.
SHL Numerical Test - Interactive Questions
Text
4. Sample Tables Question
Observe the following tale and answer the question below:
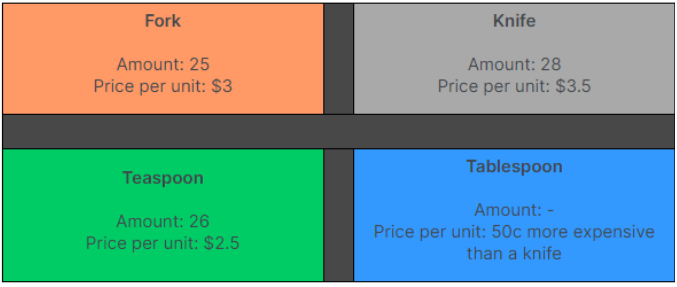
You recently moved and decided to buy new utensils. Calculate the percentage each type of utensil will cost you if you bought a total of 88 utensils. (rounding to the nearest whole number only in the last step).
*Use whole digits only.
**Note: In the interactive format of the test, you will have to adjust the pie chart based on
your calculations.
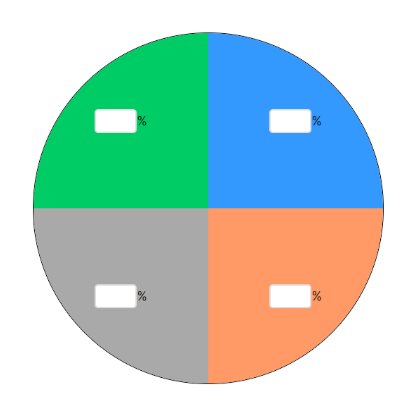
Answer:
First, we can see that there is missing data regarding tablespoons, so to calculate the required percentages, we must first retrieve the relevant data:
Number of tablespoons purchased: 88-25-28-22=9
Price of single tablespoon: $3.5+$0.5=$4
Now that we have all of the data we need, we want to calculate the total cost of each utensil so we can calculate the total cost of all utensils, and through that the percentage that each utensil accounts for.
Total cost of forks: 25*3=$75
Total cost of knives: 28*3.5=$98
Total cost of teaspoons: 26*2.5=$65
Total cost of tablespoons: 9*4=$36
Total cost of utensils: 75+98+65+36=$274
Now that we have calculated the cost of each utensil, we can calculate what percentage of the total cost each utensil is worth:
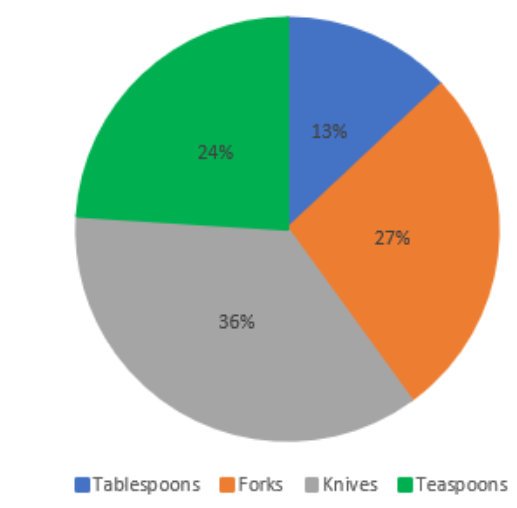
Fork cost percentage: (75/274)*100=27.37% ≈27%
Knife cost percentage: (98/274)*100=35.77% ≈36%
Teaspoon cost percentage: (65/274)*100=23.72% ≈24%
Note that we only need to calculate 3 percentages, and we can get the final percentage by subtracting the 3 we calculated from the 100% total.
SHL Numerical Tip: Since time is of the essence, and the questions require multiple calculations and interactive answers – start by understanding the question, before approaching the graph. There might be many distracting pieces of information, which should not be addressed – and starting from the graph will consume valuable time.
Note, that since the test requires answering in interactive format – practicing ahead in a similar way – just like our practice questions are built – will increase your chances of success.
5. Sample Graphs Question
Read the following information and answer the question below:
- A total of 540 new clients were acquired last year.
- The Northern region produced 40% more referrals than the Southern region.
- The Southern region produced 84 more clients through cold calls than those that were client-initiated.
- Referrals accounted for 1/3 of all new clients, were cold calls accounted for twice as many as client-initiated calls.
Arrange the number of clients who were acquired by each source and the percentages accounted for by the Southern and Northern regions.
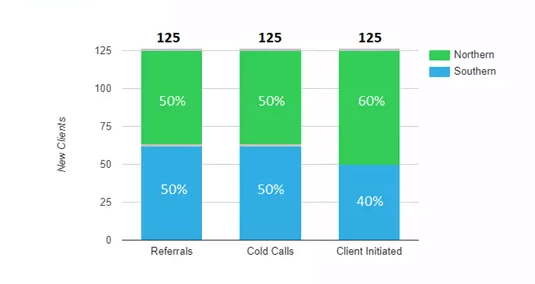
Answer:
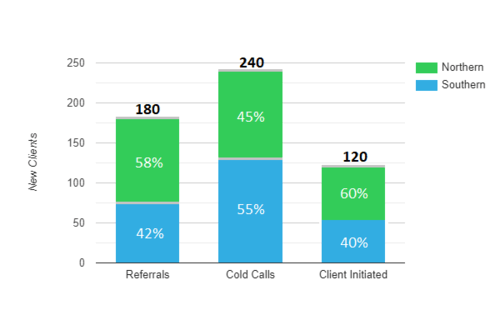
Pretty similarly to question #3 in this guide – this one is a classic case of systems of equations used to find several variables.
In this case, we have 6 variables – let’s arrange them in a table for convenience:
| Variable | Region | Method |
| NR | Northern | Referrals |
| NC | Northern | Cold Calls |
| NI | Northern | Client-Initiated |
| SR | Southern | Referrals |
| SC | Southern | Cold Calls |
| SI | Southern | Client-Initiated |
Note: This table is for the sake of explanation only. During the real test, don’t spend time arranging it, and simply name the variables as is most convenient for you.
Out of the 4 data items, the first and last ones on the list are the best place to start, as they can immediately reveal the number of clients in each method.
Let’s dismantle these pieces of data into their components:
A total of 540 new clients were acquired this year
Referrals accounted for 1/3 of all new clients

Therefore, Cold Calls and Client-Initiated account for the remaining 2 thirds of new clients:
Cold Calls + Client-Initiated = 540 - 180 = 360
Using the last bit of information - Cold Calls accounted for twice as many as Client-Initiated:
2 (Client-Initiated) + Client-Initiated = 360
Client-Initiated = 120 Clients
Cold Calls = 240 Clients
So, we can now rearrange the graph as:
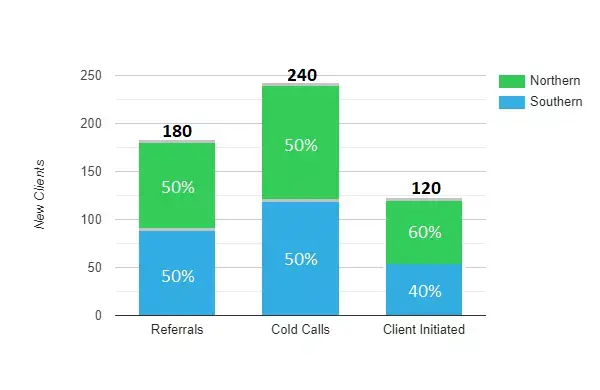
Tip: The pale grey lines above the graph indicate that you can change the value below the line. In this case, the total value of all bars can be changed, but the division of Client Initiated between Northern (60%) and Southern (40%) is pre-determined.
Now, let’s form some other equations using the other data items.
We should try and focus on data items containing the least variables. Data item 2 is the best for this purpose:
The Northern region produced 40% more Referrals than the Southern region.
Or in the form of an equation:
(I) NR = 1.4 x SR
We already know the total number of referrals:
(II) NR + SR = 180
Plugging (I) into (II):
2.4 x SR = 180
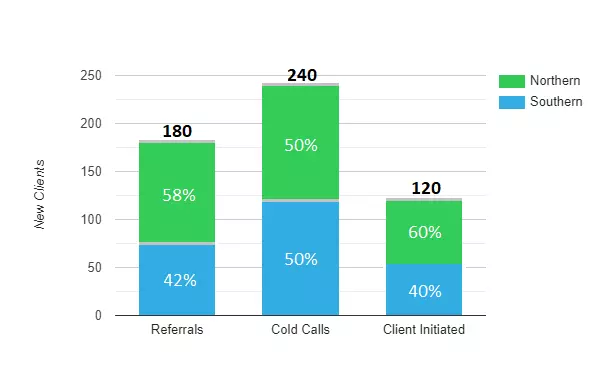
SR = 75
NR = 105
Converting to percentages (Don’t forget that!):

And again, we can rearrange the graphs as:
It is time to approach the last piece of information – data item 2:
The Southern region produced 84 more clients through cold calls than those that were Client Initiated.
Or in the shape of an equation:
SC = SI + 84
Since we already know the percentages in the Client-Initiated bar, we can easily deduce SI:
SI = 0.4 x 120 = 48
Plugging into the previous equation:
SC = 48 + 84 = 132
Again, converting into percentages:
Error loading Partial View script (file: ~/Views/MacroPartials/Picture.cshtml)And rearranging the graph to its final position.
Pass the SHL Numerical Test
Our comprehensive SHL Assessment PrepPack includes:
- 4 Full SHL General Ability simulations
- 7 Numerical Ability focused practice tests
- Comprehensive and interactive SHL Numerical Assessment guide
- Hundreds of additional SHL Numerical practice questions
- SHL Inductive and Deductive reasoning practice
Practice for More SHL Tests
SHL is an industry giant in pre-employment psychometric testing. Other common assessments in its repertoire include the SHL Inductive Reasoning Test, the SHL Deductive Reasoning Test, and the SHL Verbal Reasoning Test. These three, along with the numerical reasoning test, make up the SHL General Ability Test.
Other SHL Cognitive Assessments include the SHL Calculation test, the SHL Mechanical Comprehension Test, and the SHL Checking Test.
SHL also offers a personality test known as the OPQ32.
The company also owns the operates the Aspiring Minds Assessment (AMCAT).


